
Think You’re Diversified?
How passive investing can lead to an undiversified portfolio
By now, nearly everyone has heard about the “Magnificent 7” companies. In case you haven’t, these companies include NVIDIA, Apple, Microsoft, Amazon, Google, Meta (Facebook), and Tesla. These companies have grown to be multi-trillion dollar in size and make up a significant portion of the US stock market. In fact, at the end of May 2025, these companies accounted for more than 30% of the S&P 500 index.
In the Invesco QQQ index, which includes the 100 largest non-financial companies in the NASDAQ composite index, the “Magnificent 7” accounted for over 41% of the index. The top 4 companies alone (Microsoft, NVIDIA, Apple, and Amazon) accounted for 29.9% of the NASDAQ-100 index as of May 23, 2025.

With many of the largest exchange-traded funds (ETFs) and mutual funds emulating the S&P 500 index and NASDAQ index, numerous investors have chosen to invest in these indices passively with a significant portion of their portfolio.
Over the past decade, this has been a tremendously successful strategy. The returns of both indices have been difficult to beat compared to other methods of investing such as mutual funds or even hedge funds, and they’ve provided investors with no reason to switch strategies. Why would you when your returns have been fantastic?
These indices have typically been thought of as diversified, meaning investing in them alleviates specific company risk from your portfolio. However, concentration of the largest companies in both indices has reached levels where diversification has lost its meaning, and company risk is no longer being alleviated as it should be when investing in a basket of stocks.
How is it possible that an index consisting of 500 companies can end up with more than 30% of its allocation in only seven companies?
Let’s dive in.
Passive vs. Active Investing
I’ve been excited about writing this commentary for a long time. It’s a topic that’s heavily debated amongst investors and finance professionals, with many differing opinions. Before I get into the weeds, let’s define and briefly discuss what passive and active strategies entail.
Passive investing refers to an investment strategy where there is no professional portfolio manager “picking stocks” — rather, these funds consist of a set list of companies, often more than 100, and nobody is adjusting the weights or choosing when to include or not to include companies based on their success, future growth potential, or performance. The three most commonly well-known examples in North America are the S&P 500, the NASDAQ Composite, and the Dow Jones Industrial Average. Each of these are an index.

What’s important to note in the above table, is that the S&P 500 and the NASDAQ Composite are both market cap-weighted. What does this mean?
An index with a market cap-weighting means that the weight of each holding within the index is determined by the market value of its equity (basically how much the company is worth to investors). This means that as money flows into the index, it gets applied to the various holdings according to their respective weights. There is no professional portfolio manager strategically allocating funds to specific stocks within the portfolio, rather it’s completely based on the various company’s market values. The larger the company, the more money that’s invested into it when an index fund is purchased.
Active investing refers to funds that have a professional portfolio manager, who is tasked with picking specific companies which they believe to have better future growth potential versus other companies, and also have attractive valuations that makes sense to the manager based on this future potential. They monitor their portfolio’s allocations and exposures to specific companies and sectors very closely, to ensure it remains aligned with their views and that the risk of each company is appropriately being managed. Most mutual funds fall into this category.
The popularity of index fund investing has increased substantially over the past 10 years, due in part to its return success and ease of accessibility to essentially anyone with a smartphone. In my financial advising practice, I believe that both styles of investment (passive & active) serve a purpose in various economic climates, and there are pros and cons to each (on which I’ll take a deep dive later in this commentary). The purpose of this commentary is to show that diversification is a crucial part of a thorough financial plan, and we’re currently at a point in time where it’s difficult to achieve true diversification through passive index investing.
Market Cap-Weighting and Market Momentum
As briefly mentioned above, market cap-weighting is when larger companies hold greater weights (and therefore have greater impacts) in an index versus the smaller companies in the index. Remember that this is how the S&P 500 and NASDAQ Composite indices work.
Let’s look at a simple example.
Imagine you have $1,000 to invest. Let’s say the largest stock in the index is worth 8% (think of Microsoft or NVIDIA in the S&P 500). That means of your $1,000 investment, even though there’s 500 stocks in the fund, $80 (or 8%) will be invested in that single stock. Now imagine millions of people doing this millions times over, daily. Is it logical to think that the largest companies in the index will also increase in market value at the fastest rate? Especially in strong markets where people are investing more money than ever before? Absolutely. Is this slightly (or immensely) self-fulfilling? Yes.
Market momentum can be a powerful force. The phenomenon occurs when past high returns are followed by subsequent high returns, and past low returns are followed by subsequent low returns. Humans are wired to chase returns, and it’s because of a familiar concept called ‘FOMO’ (the fear of missing out). When the stock market is going up, investors feel the need to invest so that they don’t miss out on potential greater returns in the future. On the contrary, when the stock market is falling, investors feel the need to sell because everyone else is selling and they don’t want to endure greater losses, just like everyone else who’s selling. What this does is create market momentum, where swings in prices are enlarged due to herd mentality—in other words, massive numbers of investors all doing the same thing (buying or selling) that moves the market drastically in a very short period.
Together, and in bullish or strong markets, these two components tend to lead the stock market to form what’s called a market bubble. Stock market bubbles occur when market participants drive stock prices above their true-value in relation to some system of stock valuation. Behavioral finance theory attributes stock market bubbles to cognitive biases that lead to groupthink and herd behavior. The pairing of market-cap weighting and market momentum contribute significantly to market bubbles through the artificial inflation of stock prices, that often don’t make sense from a true-value perspective.
One of the most famous market bubbles occurred in 1999-2000, known as the “Dot Com Bubble.” In this example, internet was relatively new to the world and investors were pouring money into anything and everything that referenced internet. It didn’t matter if it was making money or if it had any intrinsic value, as long as it involved the internet, stock prices exploded. This resulted in exceptional stock price returns in the mid to late 1990s, which came crashing down by nearly 80% in the year 2000.
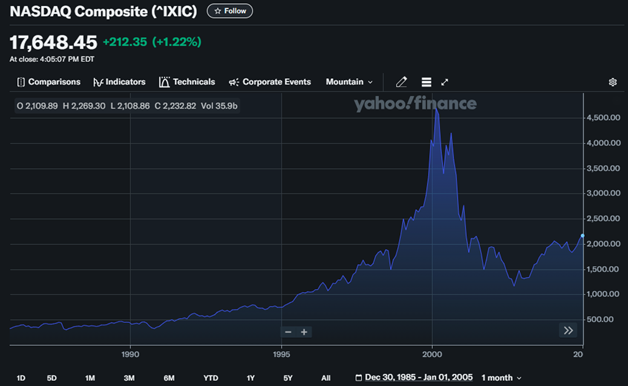
Source: Yahoo Finance: NASDAQ Composite Index
Market bubbles are nearly always paired with high market concentration of the largest companies in the index. Read that sentence one more time, because it’s probably the most important takeaway from this commentary.
What happens, is that the largest companies in the index drive the majority of returns, and are also at fault for the majority of losses when the market bubble eventually pops. During the “Dot Com Bubble” in 2000, both the S&P 500 and NASDAQ indices had a high concentration of its top 10 holdings as shown in the image below. After the bubble popped, market concentration went back to historical norms and didn’t exceed 25% again until 2020.

Since surpassing 25% concentration in 2020, the top 10 holdings in the S&P 500 has continued to become more and more concentrated surpassing 36% at the end of 2024, something that has not happened in more than 45 years.
Think You’re Diversified?
You may not be as diversified as you think by holding the S&P 500 index, NASDAQ-100 index, and MSCI World index. Let’s take a look to see what this synthetic portfolio would look like in a nutshell (as of May 23, 2025):

Does something look familiar? The top 10 names in each index are almost identical. If you own 1/3 of each of them in your portfolio, your top 10 holdings would look something like this:
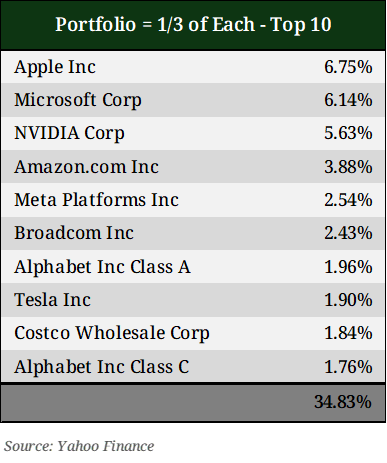
This is no coincidence. This is directly the result of market cap-weighting. The total number of holdings in your portfolio would be 1,384, which to most people sounds like a very diversified portfolio; however, 34.8% of your assets are tied to the performance of just 10 companies. Even if 1,000 of the 1,384 companies have incredible returns, if the top 10 don’t have good years, your portfolio will be heavily weighted towards their negative performance. The Magnificent 7 are expensive in relative terms to the rest of the S&P 500 index. Not only are you putting one third of your eggs into one undiversified basket, but you’re also paying for significant future growth expectations, as you can see below with a forward price-to-sales that’s nearly 3x higher than the rest of the S&P 500 index.

Let’s take it one step further and look at specific sectors. Sectors refer to the general area of business in which a company performs most of its business. If you own 1/3 of each index in your portfolio, this would be your sector breakdown from largest to smallest:

Not only is 34.8% of your portfolio concentrated in only 10 companies, but 36.0% of your portfolio is allocated to a single sector, technology. With there being 11 different sectors, having more than one third of your portfolio in a single sector is far from diversified.
Never in history has the price performance of US stocks versus the rest of the world been greater than it has been in the past decade. The MSCI All World index is supposed to capsulate the entire world of large-cap investable assets, however, 71.5% is allocated towards companies in the United States. This outperformance of US stocks has led to valuations above historical norms, partially attributed by the fact that US indices are market cap-weighted and they’ve been slowly but steadily increasing in concentration over the past decade, in correlation with the increasing popularity of ETFs.

Since the Great Financial Crisis in 2007/08, the US stock market has seen exceptional performance with no sustained periods of negative index returns. As mentioned earlier, this is largely due to the “Magnificent 7” companies, all of which are included in the top 10 holdings of the portfolio detailed above. It’s also been a period where growth stocks have out-performed value stocks—even surpassing the growth to value ratio seen during the “Dot Com Bubble” crisis of 2000.

All of this is to say, when you’re investing in index funds, it’s important to dig a little deeper to ensure you truly understand if you’re diversified, or if you’re over-exposed to a single sector or grouping of companies. Although these funds may seem diversified and they may seem like they’re providing you with exposure across the entire US stock market or the entire global market, they may very well be providing you with over-exposure to a select few companies, that will (quite literally) determine the fate of your portfolio.
The Lost Decade
Everybody talks about the amazing performance of the S&P 500 index and the NASDAQ index. It’s true, the performance since 2010 has been exceptional, but the vast majority of young investors today have only been exposed to this single bull run of stock market growth, and have not had to endure a lengthy period of negative or flat returns.
Time for a fun fact: Did you know that from 2000 until 2011, an investor who was invested in the S&P 500 index in March of 2000 would have achieved a negative price return 11.5 years later, not turning positive until the fall of 2011? That’s more than a decade of negative returns. Imagine being invested for 11.5 years and your account hasn’t budged.

As shown above, the S&P 500 index achieved a -7% price return over this 11.5 year period. A lost decade. If you think this is bad, look at what your return would have been if you had invested in the NASDAQ-100 index instead (orange line below):

Your eyes aren’t playing tricks on you. That’s a -50% return 11.5 years later. Index investing lets you ride the highs on the back of market momentum and irrational exuberance amongst investors, which is fantastic in bull markets where everything is going up, but eventually, reality kicks in and those very companies that carried the indices to such exceptional levels have a rude awakening and are re-priced to a valuation that’s more in line with historical norms.
Because of the way that true active management works, where a portfolio manager can choose companies that have growth and value for years to come, they’re able to steer clear of the momentous behemoths (Magnificent 7) that will ultimately fall the hardest when bubbles eventually pop (and inevitably will). During these 11.5 years, actively managed funds were able to achieve positive annualized returns, accomplished by weeding out and avoiding the overpriced, concentrated stocks that fell the hardest, and instead, invested in undervalued, unnoticed companies with future growth potential.
The tricky part is the time before the bubble.
In the 1990’s the NASDAQ Composite provided some of the greatest returns an index has ever seen. The S&P 500 also followed with fantastic returns. Many investors thought it was foolish to invest actively, when passively they were able to achieve the same, and likely even better returns.
Why pay money for a portfolio manager to choose stocks when you’re able to outperform with a low-cost ETF index fund?
It’s easy to have this mindset during the years where index investing works. In the 1990’s, this was a fantastic strategy that provided great returns. However, it’s important to remember that both the S&P 500 and the NASDAQ-100 are market cap-weighted indices that are prone to high concentration and market bubbles. Accordingly, they perform extremely well as bubbles form but suffer the hardest when bubbles burst as demonstrated by the S&P 500’s annualized 0.55% return (NASDAQ-100’s annualized -5.68% return) for the 12 years from 2000-2011.
Passive investing doesn’t always work.
The 15 Year Bull Run
Passive investing has overtaken active management in assets under management (AUM) over the past decade, with its ease of accessibility and popularity. The result? The formation of the Magnificent 7 and the bull run that we’ve experienced in the US since the recovery of the Great Financial Crisis.
The past 15 years have been incredible if you’ve been an index investor. In times of recovery, such as after the Great Financial Crisis, index funds are a fantastic place to be for the same reasons they’re an awful place to be when a bubble pops. In recovery, market concentration is somewhat evened out, the market is often oversold with valuations becoming appealing, and you can see the wave of momentum approaching when people begin to pile back into the stock market. This is the type of market where index investing can make sense.
This type of market does not exist at the moment, with valuations and future growth expectations of the largest US companies far exceeding historical norms of the general economy.
The Time Is Now
Concentration is at all-time highs, (or just shy of highs since we’ve pulled back in the first few months of 2025), technology is the dominant sector by a wide margin, and diversification no longer exists in the major indices. The largest companies in the indices that drive the majority of returns are expensive relative to the rest of the companies in the index, meaning you’re paying a premium for future earnings growth. The time to re-evaluate your portfolio to gain a better understanding of your diversification across sectors and companies is now. In an uncertain time such as now with trade-wars, geopolitical issues, and economic volatility, diversification is the key to positive returns as we navigate the unknown.
Are you diversified? Are your top holdings some of the Magnificent 7 companies? Ask yourself if you believe these companies can continue with the same rate of growth they’ve been able to achieve over the past 10-15 years.
If so, hold tight and stay where you are. If not, let’s chat, and together we can invest in companies that have a long runway of growth potential ahead of them, that are not already priced to perfection.
Happy investing!
Disclaimer:
The comments contained herein are a general discussion of certain issues intended as general information only and should not be relied upon as tax or legal advice. Please obtain independent professional advice, in the context of your particular circumstances. This commentary was written by Jackson Gustafson-Fish, Financial Advisor with Stratton Wealth, a registered trade name with Investia Financial Services Inc., and does not necessarily reflect the opinion of Investia Financial Services Inc. The information contained in this commentary comes from sources we believe reliable, but we cannot guarantee its accuracy or reliability. The opinions expressed are based on an analysis and interpretation dating from the date of publication and are subject to change without notice. Furthermore, they do not constitute an offer or solicitation to buy or sell any securities.
Mutual Funds are offered through Investia Financial Services Inc. Please read the Fund Facts sheet or prospectus before investing. Mutual funds are not guaranteed, their values change frequently, and past performance may not be repeated.